Generate synthetic transactional data
[1]:
import skmine

print("This tutorial was tested with the following version of skmine :", skmine.__version__)
This tutorial was tested with the following version of skmine : 1.0.0
[3]:
%matplotlib inline
from skmine.datasets import make_transactions
The make_transactions method let you generate synthetic transactions with selected properties, to carry out experiments.
[4]:
D = make_transactions(n_transactions=100,
                     n_items=10,
                     density=.2)
[5]:
D.head()
[5]:
0       [3]
1       [1]
2    [4, 5]
3       [2]
4    [7, 0]
dtype: object
Check the generated data
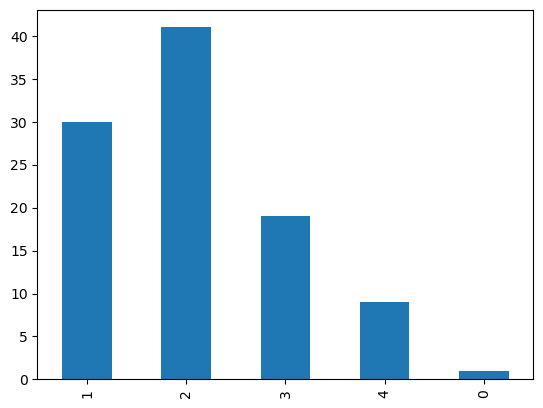
With a simple histogram, we can check the distribution of the lengths of the generated transactions.
Transaction lengths should be centered around 2 as density has been set to 20% and there are 10 items in total
[6]:
D.map(len).value_counts(sort=False).plot(kind='bar')
[6]:
<AxesSubplot:>
[7]:
from skmine.datasets.utils import describe
[8]:
describe(D)
[8]:
{'n_items': 10,
 'avg_transaction_size': 2.05,
 'n_transactions': 100,
 'density': 0.205}